Top Trumps: Mixed Asset Balanced – 27 August 2026
This week FSA provides a quick comparison of two mixed asset balanced funds: the Eastspring Asian Balanced fund and the Allianz Balanced Income and Growth fund.

This week FSA provides a quick comparison of two mixed asset balanced funds: the Eastspring Asian Balanced fund and the Allianz Balanced Income and Growth fund.
This week FSA provides a quick comparison of two mixed asset balanced funds: the Eastspring Asian Balanced fund and the Allianz Balanced Income and Growth fund.
Bank of Singapore has hired former Bank J. Safra Sarasin team head Kelly Yang.
Funds were raised from DBS Private Bank, an insurer and other institutional investors, Granite Asia said.
Funds were raised from DBS Private Bank, an insurer and other institutional investors, Granite Asia said.
Investors seek exposure to long-term structural themes that are less dependent on short-term economic cycles, says Cora Chiu, managing director, head of investment management North Asia, Deutsche Bank – Private Bank.
Sponsored by Loomis Sayles & Natixis
The Growth Equity Strategies Team at Loomis Sayles, an affiliate of Natixis Investment Managers, demonstrates that patience, discipline and conviction result in consistent, peer-leading risk-adjusted compounding over cycles.
Funds were raised from DBS Private Bank, an insurer and other institutional investors, Granite Asia said.

Stickier inflation and changing asset correlations mean income investors need to diversify their sources of yield without sacrificing exposure to long-term growth, say Karen Watkin and Fahd Malik.
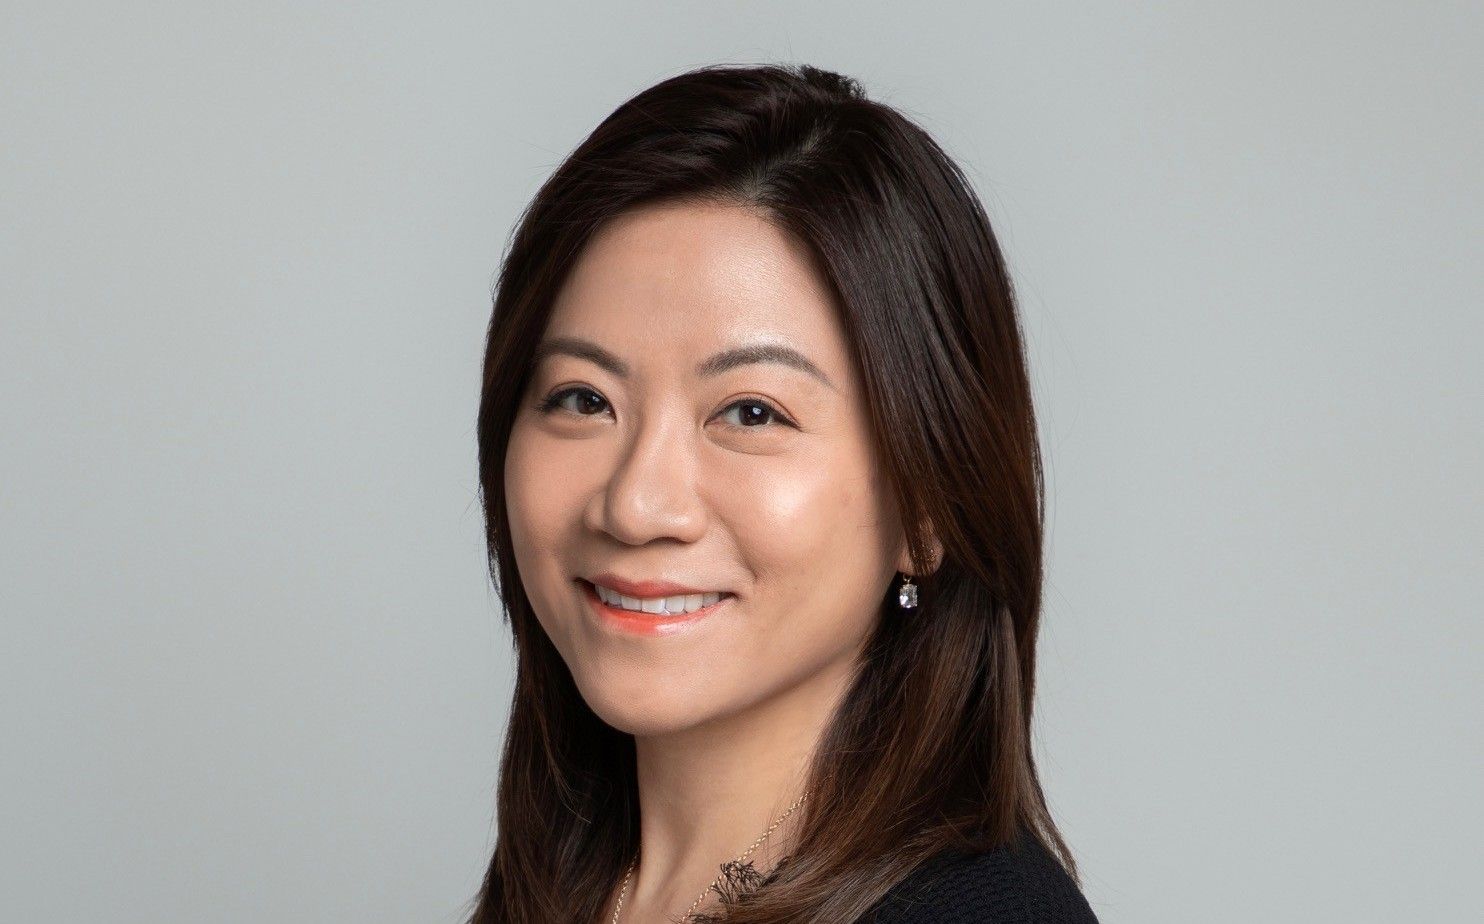
Bank of Singapore has hired former Bank J. Safra Sarasin team head Kelly Yang.
Bank of Singapore has hired former Bank J. Safra Sarasin team head Kelly Yang.
Short-dated credit also offers a compelling middle ground between cash and the broader fixed income universe, Jeffrey Tam, head fund specialists, Hong Kong, Julius Baer tells FSA.
This week FSA provides a quick comparison of two mixed asset balanced funds: the Eastspring Asian Balanced fund and the Allianz Balanced Income and Growth fund.
This week FSA provides a quick comparison of two mixed asset balanced funds: the Eastspring Asian Balanced fund and the Allianz Balanced Income and Growth fund.

FSA highlights the global equity funds that had lowest downside capture ratio and volatility alongside top-ranked returns over the past 6 months.
Bank of Singapore has hired former Bank J. Safra Sarasin team head Kelly Yang.
Bank of Singapore has hired former Bank J. Safra Sarasin team head Kelly Yang.
The private banking arm of HSBC has made four new appointments to its Singapore and India desks.
This week FSA provides a quick comparison of two mixed asset balanced funds: the Eastspring Asian Balanced fund and the Allianz Balanced Income and Growth fund.

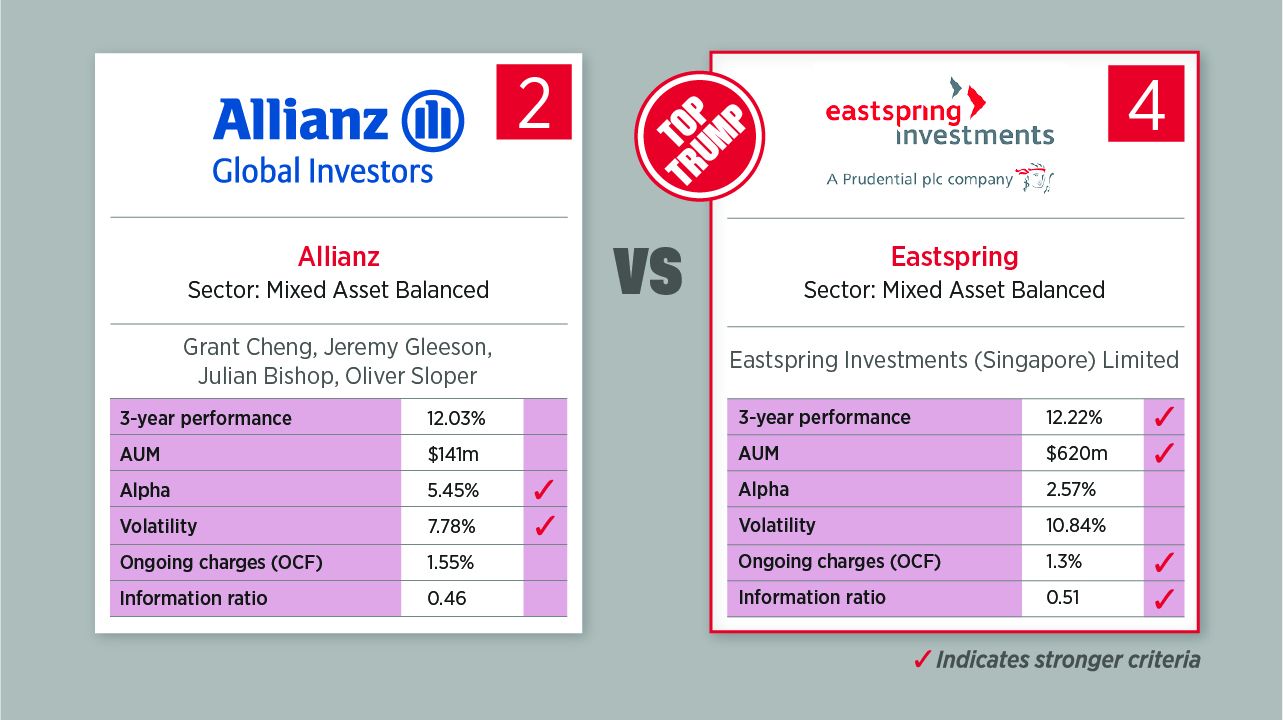
Based on the popular 80s card game, each week we select an asset class and use FE fundinfo data to compare two funds based on their three-year performance, assets under management, alpha, volatility, ongoing charges and information ratio to decide which is the Top Trump.
This week, the Eastspring Asian Balanced fund beats the Allianz Balanced Income and Growth fund 4-2.
Eastspring Asian Balanced Fund
This fund aims to maximise total return in the medium to long term by investing in a portfolio comprising of equities of companies in the Asian ex Japan region, and quality corporate bonds and other fixed income securities issued in the United States market.
Top 10 holdings
1. TAIWAN SEMICONDUCTOR MANUFACTURING CO LTD 5.1 (%)
2. SAMSUNG ELECTRONICS CO LTD 4.4 (%)
3. SK HYNIX INC 3.5 (%)
4. TENCENT HOLDINGS LTD 2.4 (%)
5. BHP GROUP LTD 1.6 (%)
6. ALIBABA GROUP HOLDING LTD 1.5 (%)
7. DBS GROUP HOLDINGS LTD 1.4 (%)
8. ASE TECHNOLOGY HOLDING CO LTD 1.2 (%)
9. NATIONAL AUSTRALIA BANK LTD 1.1 (%)
10. MEDIATEK INC 1.0 (%)
Allianz Balanced Income and Growth
This fund invests in global corporate debt securities and global equities in accordance with environmental and social characteristics.
Top 10 holdings
*All relevant fund data converted to US dollars for comparative purposes. Performance, alpha and volatility are annualised over three years with data as reported at the end of last month. Information ratio (IR) aims to measure a portfolio manager’s consistent ability to generate excess returns relative to a benchmark. The higher the IR, the more consistent the manager is.
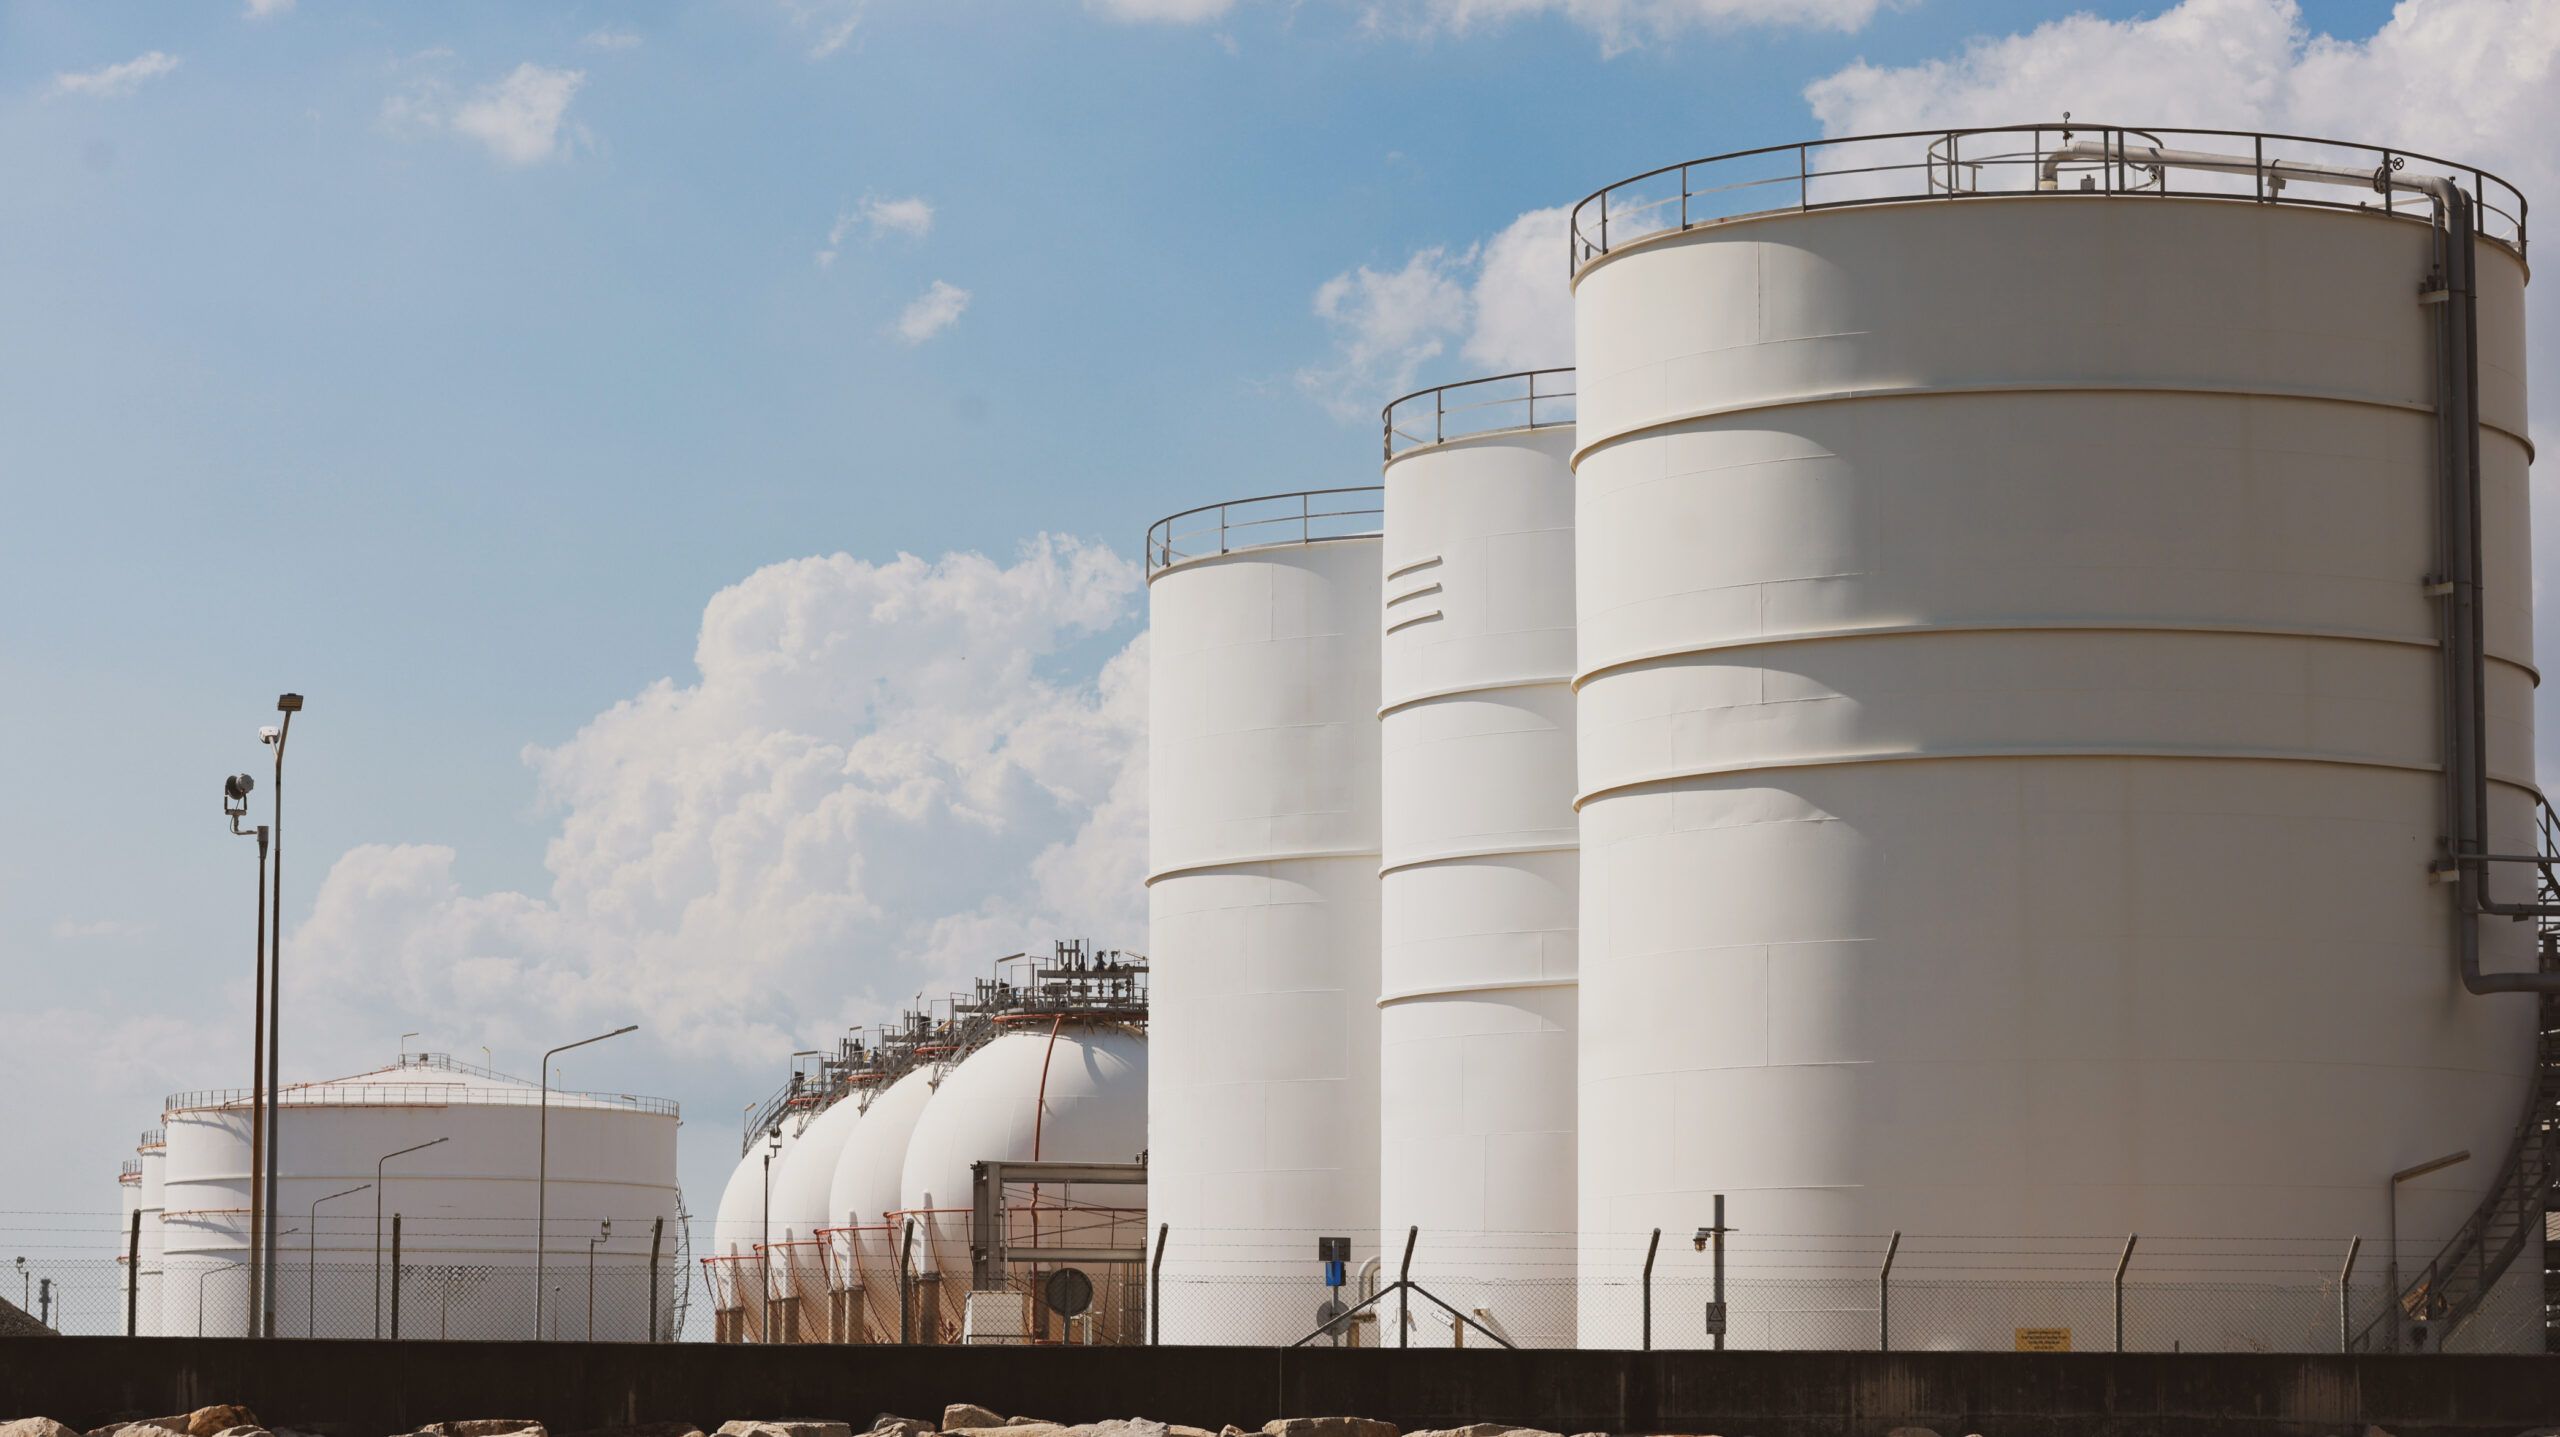
the outlook for oil and the benefits of investing in natural resources.
Ghislain Périssé has been hired from Fidelity International to head Eastspring Investment’s insurance solutions business.
Funds were raised from DBS Private Bank, an insurer and other institutional investors, Granite Asia said.